
Ham Solar | HAP Chart
Tool to show current HF propagation prediction.
Muhammad Zakwan · appinventor.ai_MzMd1494.HamSolar


UpdatedNov 5, 2025
PublishedMar 14, 2021
Packageappinventor.ai_MzMd1494.HamSolar
MD5d89658f057c54094e13956ced14121c0
SHA1 (signer)04:FB:2A:ED:4E:90:E5:44:85:61:DE:3E:DF:99:5E:62:7E:F7:22:E8
Signed by[email protected], O=AppInventor for Android, C=US
Malware scanTRUSTED
Websitehttps://zmd94.com
Contact[email protected]
What's new
v2.4.6 (23 July 2024)
- Fix list code.
- Update font typeface.
- Update new app icon.
- Update target API level requirement.
v2.4.5 (14 November 2023)
- Add follow url to Australian Space Weather Services.
- Add follow url to HrdLog.
- Add follow url to QRZ callsign database.
- Fix HF band condition code.
- Fix HAP chart map code.
- Fix HrdLog QSO map code.
- Fix QRX cluster code.
- Fix setting code.
- Remove clock component.
*** Visit Url zmd94.com/solar to see full changelog.
Description
[INTRO]
Ham Solar is using code from Paul, N0NBH website. Its requires internet connection.
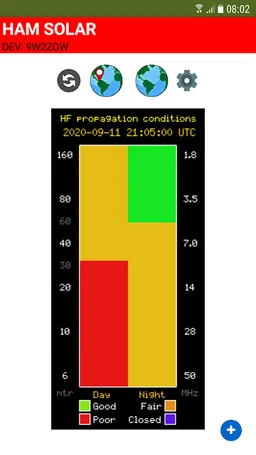
[HAP CHART]
Hourly Area Prediction (HAP) chart feature is also provided by this app. Its specifies the Maximum Usable Frequency (MUF) for HF communications between the base specified and any location on the map. The colors represent the MUF for communications between that location on the map and the base selected.
Thus, if communications are required to or from Minneapolis, a HAP chart for Minneapolis should be used. The other end of the circuit is then found on the HAP chart and the color at that location gives the MUF for that circuit.
HAP charts are charts based on current ionospheric conditions observed with ionosondes in the region of interest. This chart is only valid for the current hour due to the highly variable nature of the ionosphere.
It is also helpful to view HAP chart propagation from the perspective of distant locations. In this manner you can determine if they are able to reach the Midwest with a usable MUF.
If you love this app, please kindly to rate it and give donation to Paul. Just inform me via email if you find any problems.This app is fully designed by using MIT App Inventor 2.
Regards, 9W2ZOW.
Ham Solar is using code from Paul, N0NBH website. Its requires internet connection.
[HAP CHART]
Hourly Area Prediction (HAP) chart feature is also provided by this app. Its specifies the Maximum Usable Frequency (MUF) for HF communications between the base specified and any location on the map. The colors represent the MUF for communications between that location on the map and the base selected.
Thus, if communications are required to or from Minneapolis, a HAP chart for Minneapolis should be used. The other end of the circuit is then found on the HAP chart and the color at that location gives the MUF for that circuit.
HAP charts are charts based on current ionospheric conditions observed with ionosondes in the region of interest. This chart is only valid for the current hour due to the highly variable nature of the ionosphere.
It is also helpful to view HAP chart propagation from the perspective of distant locations. In this manner you can determine if they are able to reach the Midwest with a usable MUF.
If you love this app, please kindly to rate it and give donation to Paul. Just inform me via email if you find any problems.This app is fully designed by using MIT App Inventor 2.
Regards, 9W2ZOW.
Required features
- Faketouch android.hardware.faketouch
Permissions (2)
Ham Solar | HAP Chart requests the following Android permissions:
- Access Network State android.permission.ACCESS_NETWORK_STATE
- Internet android.permission.INTERNET