Graphical Analysis GW (Go Wireless sensor support)
Not for use with VERNIER GO DIRECT® sensors. Use Graphical Analysis 4 instead.
Vernier Software & Technology · com.vernier.android.graphicalanalysis


UpdatedDec 4, 2018
PublishedDec 4, 2018
Packagecom.vernier.android.graphicalanalysis
MD5eae8c3f212fd4fc3e40f83b0fd6eb941
SHA1 (signer)7C:55:F9:DE:B8:F2:51:45:0C:9D:05:F1:1B:CE:F7:27:3A:63:D2:77
Signed byCN=Verle Walters, OU=Technical Support, O=Vernier Software & Technology, L=Beaverton, ST=Oregon, C=US
Architecturesx86, x86-64, armeabi, armeabi-v7a, arm64-v8a, mips, mips64
Malware scanTRUSTED
Websitehttp://www.vernier.com/
Contact[email protected]
Privacy policyView
What's new
updated translations
Description
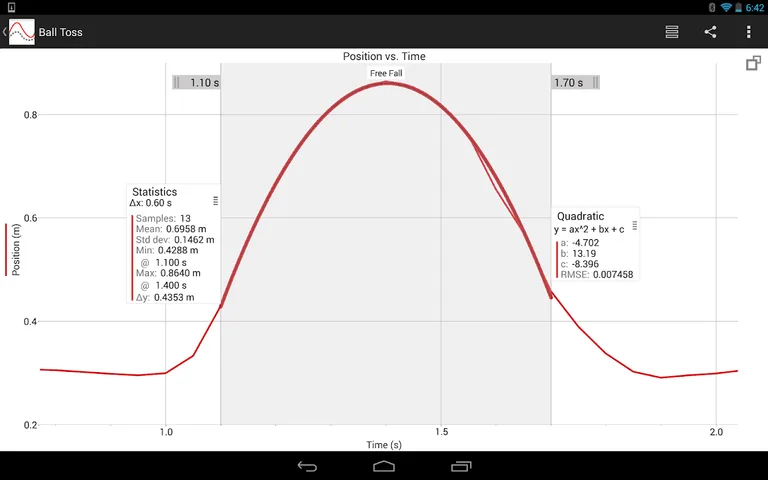
Graphical Analysis™ GW is a tool for science students to collect, graph, and analyze data from Vernier Go Wireless® sensors.
Sensor data-collection support:
• Vernier Go Wireless® Temp and Go Wireless pH sensors
• Vernier Go Wireless Heart Rate and Go Wireless Exercise Heart Rate monitors
• Vernier LabQuest® sensors used with Go Wireless Link or LabQuest Stream interfaces
Additional experiment options:
• Data Sharing via Wi-Fi connection to LabQuest 2 or Logger Pro® 3
• Built-in Sensors (accelerometers)
• Manual Entry
Note: Sensor data collection and Data Sharing require the purchase of hardware from Vernier Software & Technology. Built-in sensor and manual entry of data can be performed without a hardware purchase. For more information on Data Sharing, visit http://www.vernier.com/css
Key Features - Data Collection
• Multi-sensor data-collection support (requires LabQuest Stream)
• Time Based, Event Based data-collection modes
• Configurable data-collection rate and duration for time-based data collection
• Option to zero sensor readings
• Manual entry of data from keyboard and clipboard
Key Features - Data Analysis
• Display one, two, or three graphs simultaneously
• View data in a table or show a graph and table side-by-side
• Draw Predictions on a graph to uncover misconceptions
• Examine and select data
• Apply Statistics calculations to find mean, min, max, and standard deviation
• Perform curve fits, including linear, quadratic, natural exponent, and more
• Pinch to scale graphs
Key Features - Collaboration and Sharing
• Create text annotations and add graph titles
• Export graphs and data for printing and inclusion in lab reports
• Export data in .CSV format for analysis of data in spreadsheet software such as Excel®, Google Sheets™, and Numbers®
Note: The above features apply to version 3.2 only, available for devices running Android OS version 4.3 or newer. Android devices running OS versions 4.1-4.22 will receive Graphical Analysis version 1.2, which only supports Data Sharing, Built-in Sensors, and Manual Entry experiments.
Vernier Software & Technology has over 35 years of experience in providing effective learning resources for understanding experimental data in science and math classrooms. Graphical Analysis GW is a part of the extensive system of sensors, interfaces, and data-collection software from Vernier for science and STEM education.
Required features
- Location android.hardware.location
- Location Network android.hardware.location.network
- Sensor Accelerometer android.hardware.sensor.accelerometer
- Wifi android.hardware.wifi
Permissions (15)
Graphical Analysis GW (Go Wireless sensor support) requests the following Android permissions:
- Access Coarse Location android.permission.ACCESS_COARSE_LOCATION
- Access Network State android.permission.ACCESS_NETWORK_STATE
- Access Wifi State android.permission.ACCESS_WIFI_STATE
- Bluetooth android.permission.BLUETOOTH
- Bluetooth Admin android.permission.BLUETOOTH_ADMIN
- Camera android.permission.CAMERA
- Change Wifi Multicast State android.permission.CHANGE_WIFI_MULTICAST_STATE
- Change Wifi State android.permission.CHANGE_WIFI_STATE
- Flashlight android.permission.FLASHLIGHT
- Internet android.permission.INTERNET
- Manage Documents android.permission.MANAGE_DOCUMENTS
- Read External Storage android.permission.READ_EXTERNAL_STORAGE
- Vibrate android.permission.VIBRATE
- Wake Lock android.permission.WAKE_LOCK
- Write External Storage android.permission.WRITE_EXTERNAL_STORAGE