


UpdatedApr 2, 2023
PublishedApr 2, 2023
Packagecom.mcnvr.amfmmodulator
MD506660cdb42aa1c6ba4caa96ea7d25c69
SHA1 (signer)98:F4:F4:15:F0:A4:13:0A:7C:74:53:E0:69:08:EB:12:26:A7:28:C1
Signed byCN=Mevl?t Canvar, OU=Mobile App, O=Personal, L=Safranbolu, ST=Turkey, C=TR
Malware scanTRUSTED
Websitehttp://mevlutcanvar.com.tr
Contact[email protected]
What's new
-privacy policy link added
-improved
-improved
Description
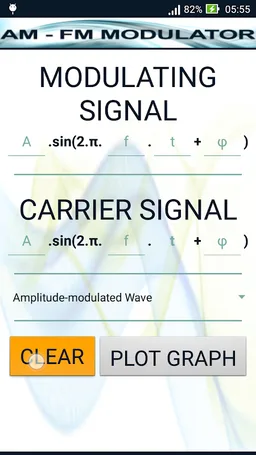
AM-FM Modulator is a wave modulator and graph sketcher. There is a model signal whic can called either data or modulating signal and also the carrier signal. You can set the values of signal like Amplitude, Frequency, Phase and the interval of time that graph will show.
Application make samples of points in two dimentional space and plot the graph. Samples depends the time interval that you set. Each time unit has one hundred sample point for the graph. After data prepared user can see four different graph: Modulating Wave Graph, Carrier Wave Graph, Modulated Wave Graph and a Multi Waves Graph that shows Modulating and Modulated Waves.
Here Some Wiki info:
Amplitude modulation (AM) is a modulation technique used in electronic communication, most commonly for transmitting information via a radio carrier wave. In amplitude modulation, the amplitude (signal strength) of the carrier wave is varied in proportion to the waveform being transmitted.
Formulas:
c(t) = A . sin( 2.π.fc.t)
m(t) = M . cos( 2.π.fm.t + φ)
y(t) = [1 + m(t)] . c(t)
Angle modulation is a class of analog modulation. These techniques are based on altering the angle (or phase) of a carrier signal to transmit data. This as opposed to varying the amplitude of the carrier, such as in amplitude modulation transmission.
Formulas:
s(t) = A . cos( 2.π.fc.t + φ(t) )
PM: φ(t) = np . m(t), where np is parameter called phase modulation index.
FM: φ'(t) = nf . m(t), where nf is the frequency modulation index and φ’(t).
For Developers: This project shared on GitHub: https://github.com/Crx4/AM-FM-Modulator
Attention: Trying big decimal numbers to plot the graph may cause crash, please try only acceptable values by a mobile phone. By installing the app you will take all the responsibility.
Required features
- Faketouch android.hardware.faketouch
Permissions (2)
AM-FM Modulator requests the following Android permissions:
- Access Network State android.permission.ACCESS_NETWORK_STATE
- Internet android.permission.INTERNET