
Air quality app & AQI widget
Air quality index (AQI) app and air pollution widget from AirNow & Copernicus
Elecont software · com.elecont.airquality


UpdatedMar 17, 2024
PublishedOct 21, 2020
Packagecom.elecont.airquality
MD5b60673d4772c308f07f63f77f8b2f4c5
SHA1 (signer)C5:E9:7F:8B:3B:11:7C:DA:B3:0A:C8:FE:3B:01:88:5E:54:68:2D:5D
Signed byCN=Android, OU=Android, O=Google Inc., L=Mountain View, ST=California, C=US
Malware scanTRUSTED
Websitehttp://elecont.com
Contact[email protected]
Privacy policyView
What's new
Added the ability to pin a air quality stations in the list of stations
Added the ability to arrange air quality stations list
Added the ability to arrange air quality stations list
Description
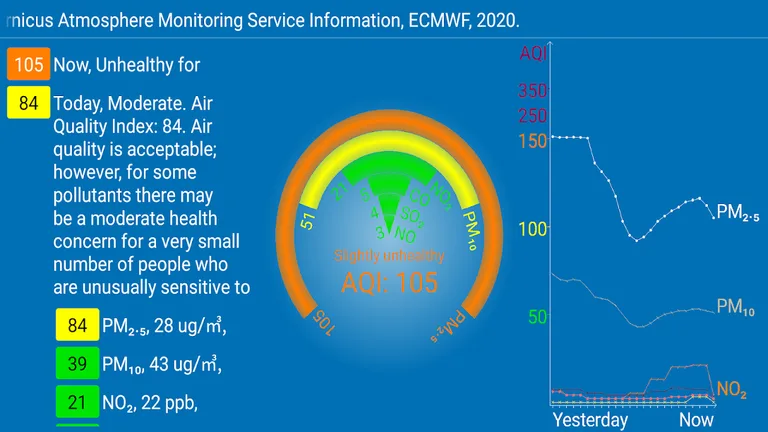
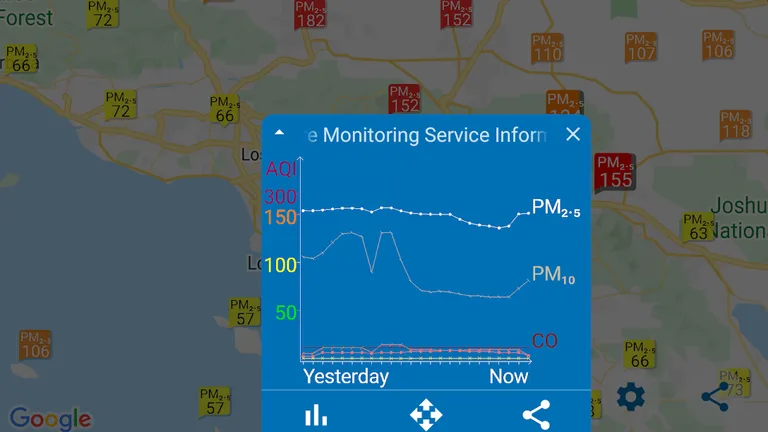
eAirQuality displays air quality index (AQI), air pollution and air matters on a map and in widgets. Concentrations of pollutants in the air are displayed from various sources: AirNow, Copernicus, ECMWF, etc.
eAirQuality displays concentrations of fine particulate matter PM10, coarse particulate matter PM2.5, nitrogen oxide NO, sulfur dioxide SO2, ozone O3 and other substances.
eAirQuality uses several data providers. Therefore you can compare data from different sources.
eAirQuality shows the current concentration of pollutants, a graph of changes over the last 24 hours and a forecast for several days ahead. The forecast is only available for some data sources.
Animations add a special touch to the app.
Interactive widgets allow you to see the AQI directly on your phone's desktop without having to launch a program.
The Air Quality Index used in the app ranges from 0 to 500, with 0 representing ideally clean air and 500 representing the most polluted air.
Air has a direct impact on human health. Find out what you are breathing with our app.
Required features
- Faketouch android.hardware.faketouch
- Location android.hardware.location
Permissions (13)
Air quality app & AQI widget requests the following Android permissions:
- Access Adservices Ad Id android.permission.ACCESS_ADSERVICES_AD_ID
- Access Adservices Attribution android.permission.ACCESS_ADSERVICES_ATTRIBUTION
- Access Adservices Topics android.permission.ACCESS_ADSERVICES_TOPICS
- Access Coarse Location android.permission.ACCESS_COARSE_LOCATION
- Access Fine Location android.permission.ACCESS_FINE_LOCATION
- Access Network State android.permission.ACCESS_NETWORK_STATE
- Foreground Service android.permission.FOREGROUND_SERVICE
- Internet android.permission.INTERNET
- Wake Lock android.permission.WAKE_LOCK
- Com Android Vending Billing com.android.vending.BILLING
- Com Elecont Airquality Dynamic Receiver Not Exported Permission com.elecont.airquality.DYNAMIC_RECEIVER_NOT_EXPORTED_PERMISSION
- C2dm Permission Receive com.google.android.c2dm.permission.RECEIVE
- Gms Permission Ad Id com.google.android.gms.permission.AD_ID